
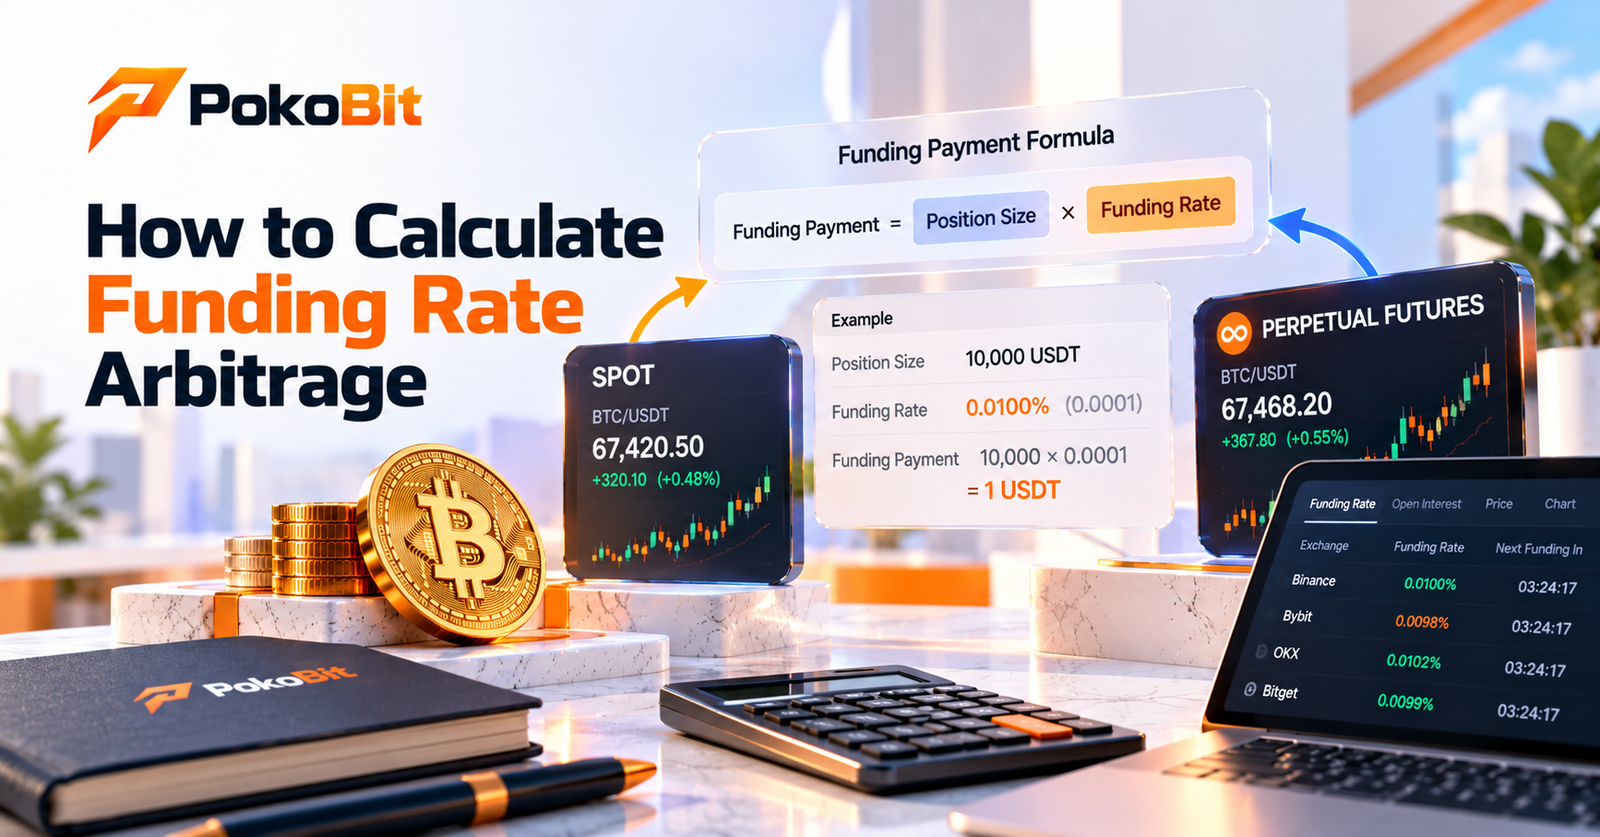
How to Calculate Funding Rate Arbitrage
Funding rate arbitrage can look simple at first: find a favorable funding rate, take an opposite position in the spot market and perpetual futures market, and collect the funding payments.
The difficult part is calculating whether the funding income is actually enough to cover trading fees, slippage, price differences, margin requirements and changes in the funding rate.
This guide explains how to calculate funding rate arbitrage using real Binance market data and a step-by-step example.
What Is Funding Rate Arbitrage?
Funding rate arbitrage is a strategy that attempts to earn funding payments from perpetual futures while using an opposing spot position to reduce directional exposure.
A common setup is:
Buy the cryptocurrency in the spot market.
Short the equivalent value of the perpetual futures contract.
When funding is positive, longs generally pay shorts, so the short futures position may receive funding.
When funding is negative, shorts generally pay longs, meaning the same setup may incur funding costs.
Binance describes this structure as a delta-neutral strategy where a spot position can hedge an equivalent futures position.
For a broader explanation, see How Does Funding Rate Arbitrage Work?.
The Basic Funding Rate Arbitrage Formula
The basic calculation is:
Funding Payment = Position Notional × Funding Rate
For example, if the perpetual futures position is worth $20,000 and the funding rate is 0.02%:
$20,000 × 0.02% = $4
The estimated funding payment would therefore be $4 for that funding event.
Binance also defines funding fees using the position value multiplied by the funding rate.
However, this is only the gross funding payment.
To estimate the actual result, you need to account for costs.
Net Funding Arbitrage Profit
A more useful calculation is:
Net Funding Return = Funding Income − Trading Fees − Slippage − Other Applicable Costs
For a longer holding period, you also need to consider whether the funding rate changes.
For example:
Funding income: $50
Trading fees: $15
Slippage: $5
Other costs: $3
Estimated net return:
$50 − $15 − $5 − $3 = $27
The important point is that the funding rate alone does not tell you whether an arbitrage opportunity is profitable.
A Real Binance Example
Let's use Bitcoin on Binance as a real market example.
At the time this article was prepared, Binance's BTC/USDT spot market was around $84,823, while Binance Futures BTC/USDT was around $84,007 according to current exchange-market data. The reported BTC/USDT perpetual funding rate was approximately -0.005%, with shorts paying longs.
These numbers change continuously, so they should be treated as a market snapshot rather than a permanent rate.
The negative funding rate is particularly important.
If a trader buys BTC spot and shorts BTC perpetual futures under these conditions, the trader would generally be paying funding on the short futures position rather than receiving it.
So this is not currently an attractive example of the classic positive-funding strategy.
That is an important lesson: a funding arbitrage calculation should start by checking the direction of the funding payment.
Calculating the Current BTC Funding Cost
Suppose a trader has:
Spot BTC position: $20,000
BTCUSDT perpetual short: $20,000
Current funding rate: -0.005%
The approximate funding payment is:
$20,000 × -0.005% = -$1
The negative sign indicates that the short position is paying rather than receiving under this funding condition.
If the rate remained unchanged for three equivalent funding events, the approximate funding cost would be:
$1 × 3 = $3
Again, this assumes the rate remains unchanged and the same notional remains open.
In reality, funding rates can change between payment periods.
What If the Funding Rate Is Positive?
Now consider a hypothetical positive funding rate of 0.02%.
This is an illustration rather than the current Binance BTC rate.
Suppose:
Spot position: $20,000
Perpetual short: $20,000
Funding rate: +0.02%
The calculation becomes:
$20,000 × 0.02% = $4
The trader would potentially receive approximately $4 for that funding event if the short position is the funding recipient.
If there were three identical funding events:
$4 × 3 = $12
This is gross funding income.
It does not mean the trader has made $12 in net profit.
How Often Is Funding Paid?
Funding is not necessarily paid at the same interval for every perpetual contract.
Binance states that the standard funding interval has historically been eight hours, but funding intervals can be adjusted for certain contracts based on market conditions. The exchange displays the relevant funding interval and upcoming funding information for each contract.
Therefore, do not simply multiply a funding rate by three without checking the specific contract's current funding schedule.
The correct calculation should use the actual number of funding events expected during the holding period.
Calculating Funding Income Over Multiple Payments
Suppose a trader holds a $25,000 perpetual short position.
Assume, purely for illustration, that the funding rate remains at 0.015% for three funding events.
Funding per event:
$25,000 × 0.015% = $3.75
Three events:
$3.75 × 3 = $11.25
Estimated gross funding income:
$11.25
But if the funding rate changes during the period, you need to calculate each funding event separately.
For example:
Event 1: $25,000 × 0.015% = $3.75
Event 2: $25,000 × 0.010% = $2.50
Event 3: $25,000 × -0.005% = -$1.25
Total:
$3.75 + $2.50 − $1.25 = $5.00
This is much more realistic than assuming the first funding rate will remain unchanged.
Funding Rate vs Funding Payment
These two terms should not be confused.
The funding rate is the percentage.
The funding payment is the actual amount paid.
For example:
Funding rate: 0.02%
Position value: $50,000
Funding payment:
$50,000 × 0.02% = $10
If the position value doubles to $100,000 while the rate stays the same:
$100,000 × 0.02% = $20
The funding rate did not change, but the funding payment doubled because the position size doubled.
How to Calculate the Required Position Size
You can also reverse the formula.
If you want to estimate the position size needed to generate a particular funding payment:
Position Size = Desired Funding Payment ÷ Funding Rate
For example, suppose the funding rate is 0.02% and the desired funding payment is $10.
Position size:
$10 ÷ 0.0002 = $50,000
So a $50,000 position would produce approximately $10 at a 0.02% funding rate.
However, the funding rate can change, so this should not be interpreted as a guaranteed recurring return.
Calculating the Break-Even Funding Rate
This is one of the most useful calculations for arbitrage traders.
Suppose your total estimated costs for entering and exiting the strategy are $40.
You expect to hold a $20,000 hedged position for three funding events.
What funding rate would you need to break even?
First calculate the required total funding:
$40
Then divide it by the position size:
$40 ÷ $20,000 = 0.002
Convert to a percentage:
0.002 × 100 = 0.20%
If there are three equal funding events, the required rate per event would be approximately:
0.20% ÷ 3 = 0.0667%
So the strategy would need to generate approximately 0.0667% per funding event over three events just to cover the assumed $40 in costs.
This demonstrates why a seemingly attractive funding rate may not actually be profitable after expenses.
Using Binance BTC, ETH and SOL as Examples
Current Binance Futures market data provides a useful illustration of how different funding rates can vary between assets.
At the time of the market snapshot:
| Pair Approx. Perpetual Price Funding Rate Funding Direction | |||
| BTC/USDT | $84,007 | -0.005% | Shorts pay longs |
| ETH/USDT | $2,604 | -0.001% | Shorts pay longs |
| SOL/USDT | $117.83 | -0.009% | Shorts pay longs |
These figures are live-market snapshots and can change quickly.
The important observation is that all three examples currently have negative funding.
Therefore, someone using the classic spot-long plus perpetual-short structure would generally be paying funding rather than collecting it at those displayed rates.
This is why an arbitrage scanner should evaluate the funding direction instead of simply displaying the largest percentage.
How to Calculate ETH Funding
Suppose a trader has a $10,000 ETH perpetual short.
Using the current illustrative Binance Futures funding rate of approximately -0.001%:
$10,000 × -0.001% = -$0.10
The negative result means the short position would pay approximately $0.10 for that funding event under the stated rate.
If the funding rate later becomes positive, the calculation changes.
For example, at a hypothetical +0.015%:
$10,000 × 0.015% = $1.50
The same $10,000 position would potentially receive $1.50 for that funding event.
How to Calculate Funding Arbitrage After Fees
Suppose:
Spot position: $20,000
Perpetual short: $20,000
Funding received: $30
Opening and closing trading fees: $12
Slippage: $6
Other costs: $2
Net result:
$30 − $12 − $6 − $2 = $10
The trader's estimated net funding return would therefore be $10.
This calculation is much more useful than simply saying:
"The funding rate is positive."
Don't Ignore the Spot-Futures Price Difference
Funding is not the only variable.
The price difference between the spot asset and perpetual contract can also affect the economics of the trade.
For example, if the trader buys spot BTC at one price and shorts the perpetual at another, the initial spread between those positions matters.
This is particularly important when entering and exiting large positions.
For more background on this relationship, see What Is Spot-Futures Arbitrage?.
A Practical Calculation Workflow
A practical funding arbitrage calculation can follow this process:
- Choose the cryptocurrency and perpetual contract.
- Check the current funding rate.
- Confirm whether longs or shorts pay.
- Check the funding interval.
- Determine the intended position size.
- Calculate the expected funding payment.
- Estimate how many funding events will occur.
- Account for possible changes in the funding rate.
- Calculate trading fees.
- Estimate slippage.
- Consider other applicable costs.
- Calculate the estimated net return.
- Compare the result with the capital committed.
This approach gives you a much clearer picture of the actual opportunity.
Can Funding Rate Arbitrage Calculations Be Automated?
Yes.
An arbitrage scanner can continuously collect:
- Current funding rates
- Funding direction
- Spot prices
- Perpetual prices
- Position sizes
- Funding intervals
- Trading fees
- Liquidity
- Estimated slippage
It can then calculate an estimated net return for each opportunity.
This is particularly useful because funding rates can change quickly.
For traders interested in automated crypto arbitrage analysis, PokoBit focuses on identifying arbitrage opportunities across cryptocurrency markets.
Common Mistakes When Calculating Funding Arbitrage
Treating the Funding Rate as Profit
A 0.02% funding rate is not the same thing as a 0.02% net return.
Fees, slippage and other costs must be considered.
Ignoring the Funding Direction
A negative funding rate can mean that the position you expected to profit from funding is actually paying it.
Assuming the Rate Will Stay Constant
Funding rates can change from one interval to another.
Calculations should account for different possible funding scenarios.
Ignoring Position Size
A funding rate is a percentage. The actual payment depends on the notional value of the position.
Ignoring Liquidation and Margin
A hedge does not remove the requirements of the futures market.
The futures position still needs sufficient margin and appropriate risk controls.
Conclusion
Calculating funding rate arbitrage starts with a simple formula:
Funding Payment = Position Notional × Funding Rate
But a serious calculation goes further.
You need to account for the funding direction, funding interval, position size, changing rates, trading fees, slippage, spot-futures price differences and other costs.
The current Binance example also demonstrates why this matters. BTC/USDT, ETH/USDT and SOL/USDT were showing negative funding in the market snapshot used for this article, meaning shorts were paying longs rather than receiving funding.
The best funding arbitrage opportunity is therefore not necessarily the token with the highest displayed funding rate. It is the opportunity with the most attractive expected net return after all relevant costs and risks are considered.